The Truth About How Outrageous Payment Costs Bleed Society Dry
These costs show why we desperately need CBDC and Digital Public Infrastructure!
Once again, McKinsey’s annual payment report shows us how payment costs are simply bleeding society dry and desperately need to change.
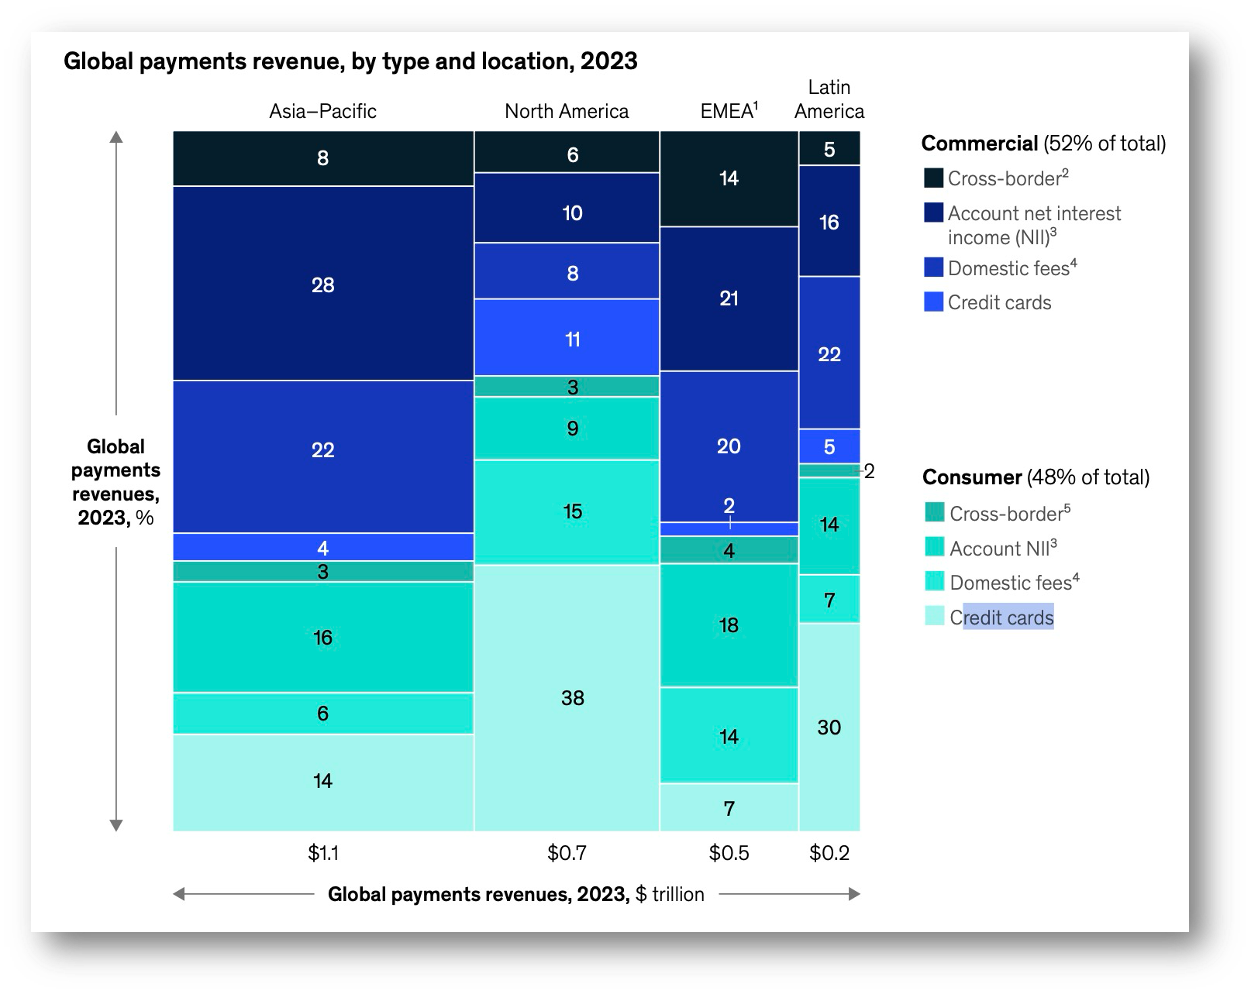
McKinsey’s analysis shows payment revenue attributed to banks across the globe, and the numbers are shocking and, frankly, in my view, repulsive.
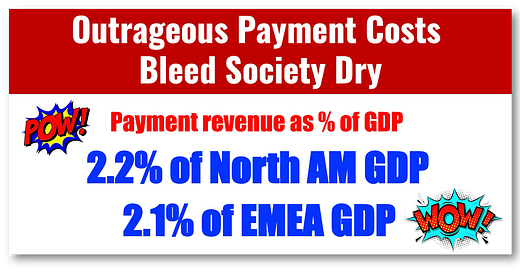
The North American market spends 2.2% of its GDP on payments, while the European Mid-East and African markets spend 2.1%!
Think of what this means for economies that strive to eke out growth in fractions of a percent!
👊STRAIGHT TALK👊
McKinsey presents these numbers in raw form and is not brave enough to show the comparison to GDP to give readers a better perspective on how much they are paying!
The “revenue” figures McKinsey cites accrue predominantly to banks and card companies and should be seen as a tax on all of society.
I look at these numbers, and frankly, they make me mad and show why we need payment system modernization through CBDC and “digital public infrastructure” now!
Please stop telling me that CBDCs are a solution for a problem!
With costs this high, the problem is evident, but central banks and bankers don’t want to see it!
What do you think?
👉Calculations and Perspective
🔹North American Payment and Card Revenue
-North America: 2023 GDP of the US+Canada+ Mexico= 27.3+2.1+1.8= $31.2
-Total Revenue from payments = $.7 trillion.
-Total Payment Revenue as a percent of GDP= 2.2%
🔥PERSPECTIVE: the US military budget is $.841 trillion compared to $.7 trillion in payment revenue.
US Cards Only
-Percentage of revenue attributed to credit cards = 49% or $.34 trillion
-🔥PERSPECTIVE: US Veterans benefits are 5% of US spending at $.30 trillion
🔹Europe, Middle East and Africa Payment and Card Revenue
-EMEA: 2023 GDP of the EU+Middle East+ Africa= 17.1+3.5+3.1 = $23.7
-Total Revenue from payments = $.5 trillion.
-Total Payment Revenue as a percent of GDP= 2.1%
🔥PERSPECTIVE: the EU total budget for 2023 was $.186 trillion compared to $.5 trillion in payment revenue.
EMEA Cards Only
-Percentage attributed to credit cards = 9% or $.045 trillion
-I suspect something is wrong with these numbers. The EU had around 30% of total revenue attributed to cards in prior years. I suspect the ME and Africa components, where card use represents a lower percentage of GDP, may have played a role.
🔹APAC
-APAC: 2023 GDP of the entire region (Wikipedia)= $35.3
-Total Revenue from payments = $1.1 trillion.
-Total Payment Revenue as a percent of GDP= 3.1%
APAC Cards Only
-Percentage attributed to credit cards = 18% or $.19 trillion
Please restack!
Readers like you make my work possible! Subscribing is free, and I use the same business model as public broadcasting, where you can get all of my writing for free. If you like the content, please buy me a coffee by subscribing. Thank you!
Sponsor Cashless and reach a targeted audience of over 50,000 fintech and CBDC aficionados who would love to know more about what you do!


